9 Things You Need To Know About Financial Statements

Financial StatementEvery business owners, company investors and board of directors would like to see how their company performing financially. A need for preparing financial statements becomes a routine part for any organization. These financial statements tell business owners, companies board of directors a true picture about the health of their organization. Therefore, interpreting and understanding these financial statements becomes important on the part of investors, owners and companies board of directors.

What is Financial Statements?

Financial statements are formal record of the financial activities and position of a business, person, or any organization or a legal entity. The financial activities are presented in a structured manner which is easy to read and understand by any individual. The key financial information’s are recorded either on:

  • Income Statement
  • Balance Sheet
  • Statement of Cash Flow

In this article, I will explain you what the financial statements have to offer and how to use them to work in your favor.

  1. Business Investor and Financial Analyst all use Balance Sheet, Income statement and Statement of cash flow before making any financial decision. These statements truly reflect the financial health of any organization. The other statements such as statement of owner equity, retained earnings are important too but not critical. Investors can refer them also to make their financial decision.
  2. The financial statements are widely used to develop a score card to help business owner to compare the score card with actual and make any decision if there is any variance between the score card and actual results. Financial Analyst prepares this score card based on the historical financial information presented by the company in the form of Financial Statements.
  3. The financial statements are widely used by financial analyst to calculate various financial ratios which tend to show an indicator of company present performance and where company is heading in the future. These financial ratios are often presented to board of directors or investors for review.
  4. An active investor likes to see these statements before investing in to company. The auditor of company uses these financial statements to prepare his audit report. The audit report can either be unaudited which is based on mid-year financial statement and final auditor report which is normally completed after the company financial reporting period ends.
  5. If the company owns several other subsidiaries companies, the financial statements can also be prepared as consolidated financial statement where it includes financial information of both parent company and all its subsidiaries companies.
  6. GAAP (generally accepted accounting principles) rules followed by majority of large companies which allow the company to prepare their financial statements according to GAAP. There are basically two conventions, one of historical cost and other one accrual accounting, according to GAAP, the assets are valued at their historical cost whereas revenues and expenses are recoded when they are incurred. Therefore, the investor should really need to understand the statement of cash flow of any organization to see health of the company performance.
  7. Income statement is another statement that cannot be overlooked by any investor. Income statement normally reveals the ability of a business of how much business generates a profit. On the other hand, it does not reflect how much of assets and liabilities business required to generate a profit.
  8. Investor or financial analyst can perform a variance analysis if they have the financial information’s to see some powerful indicator such as profitability trend, sales trend and revenue trend. These variance analyses help the investors to make their financial decisions.
  9. Cash flow statement is the most important financial statement for any business mainly because it focuses solely on changes in cash inflows and outflows over a period of time. This report presents investors a more clear view of a company’s cash flows than the income statement, which can sometimes present skewed results, especially when accruals are required to be maintained according to GAAP

Conclusion:

An overview of the above financial statement helps the readers to see a bigger picture of the company. However, the beginning investor should also prepare to learn more about investment qualities before they invest in the companies.

Still confused about financial statement? Connect with online accounting tutor to understand more about financial statements and improve learning before investing.

Guide To Understanding And Setting Up The Chart Of Accounts For Any Business

Chart of accountsChart of accounts are those accounts which are commonly used by medium or large corporation to classify its income statement, balance sheet items in a structured way by department, expenses, incomes, assets and liabilities of an organization.

It is also a powerful tool for any organization to manage its expenses, revenue, assets and liabilities in order to understand the overall financial health of the organization. Normally all the charts of account run using accounting software which aggregate the entity financial information. The information can be sorted by department for any time frame.

Each account in the chart of accounts is typically assigned a unique number by which it can be identified. The unique number generally starts from numerical number from 1-5 where:

1 Represent Current Assets

2 Represent Current Liabilities

3 Represent Operating Incomes

4 Represent Cost of Goods Sold

5 Represent Operating Expenses

How to set up the chart of accounts?

Business owners can set up their business chart of accounts as shown below. As you can see in the table below, each account is assigned a unique number which is 5 digits long. It is the industry standard however, the business can shorten or make longer number as they wishes.

Assets Side of Balance Sheet (account numbers start with 1)

Current Assets

10100 Cash – Regular Checking

10200 Cash – Payroll Checking

10600 Petty Cash in hand

12100 Accounts Receivable

12500 Provision for bad debt

13100 Inventories

14100 Supplies

15300 Prepaid Insurance

Fixed Assets:

17000 Land

17100 Buildings

17300 Equipment

17800 Vehicles

18100 Accumulated Depreciation – Buildings

18300 Accumulated Depreciation – Equipment

18800 Accumulated Depreciation – Vehicles

Liabilities Side Of Balance Sheet (account numbers start from 2)

Current Liabilities:

20110 Notes Payable- Line#1

20210 Notes Payable -Line #2

21000 Accounts Payable

22100 Wages Payable

23100 Interest Payable

24500 Unearned Incomes

Long-term Liabilities

25100 Mortgage Loan Payable

25600 Bonds Payable

25650 Discount Payable

Stockholders’ Equity

27100 Common Stock

27500 Retained Earnings

29500 Treasury Stock

Operating Incomes (account numbers start with 3)

31010 Sales

31022 Sales

32016 Sales

33110 Sales

Cost of Goods Sold (account numbers start from 40000)

41010 Cost of Goods Sold-Line#1 (COGS)

41022 Cost of Goods Sold -Line#2 (COGS)

42016 Cost of Goods Sold -Line#3 (COGS)

43110 Cost of Goods Sold -Line#4 (COGS)

Operating Expenses (account numbers start from 5)

50100 Salaries (Marketing)

50150 Payroll Taxes (Marketing)

50200 Supplies (Marketing)

50600 Telephones (Marketing)

59100 Salaries (others)

59150 Payroll Taxes (others)

59200 Supplies (others)

59600 Telephone (others)

Following the above structure, organization can structure their chart of accounts by expense, by sales department, marketing department, Engineering department and accounting department.

Still confused about how to set up chart of accounts? Connect with expert Online Accounting Tutor right now and learn how to set up chart of accounts for your business.

15 Financial Ratios Every Business Owners Needs to Know

Financial Ratios, Balance Sheet, Income StatementFinancial ratios or accounting ratios are most commonly used by every businesses and companies to determine or evaluate the overall financial health of the business and companies. These ratios are frequently used by financial analyst, managers, shareholders, creditors to find out about the strength and weaknesses of the any organization.

The data used in calculating financial ratios comes from either income statement, profit and loss account, cash flow statement or company balance sheet. These financial ratios allow the companies to compare its financial strength between companies, industries, different time period for one company. These rations are measured always against benchmark set by a company. Without benchmark, these ratios are not so useful. Company have to have some kind of industries benchmark set to compare against its financial ratios.

Most publicly traded companies are required by law to use generally accepted accounting principles (GAAP) for their home country. However, the private companies such as LLC, partnership, private companies are not required to use GAAP method.

There are primarily four main categories of financial ratios that all business used to analyze its data:

  1. Profitability Ratios
  2. Liquidity Ratios
  3. Debt Ratios
  4. Activity Ratios


Let’s elaborate further about all the above financial ratios:

1: Profitability Ratios: These ratios allow companies to measure its ability to make adequate return on sales, total assets and invested capital. In other words, these ratios measure how effectively a company utilizes its resources. Some of the profitability ratios are as follows:

Profit margin ratio: profit margin ratio is calculated by dividing the net income by sales over a reporting period. For example: if company earns net income for $25,000 in a reporting period and its sales amounted to $250,000, the profit margin ratio can be calculated as follows:

Profit Margin Ratio:    Net Income/Sales

Profit Margin:             $25,000/$250,000

= 10%

Return on Investment Assets: Return on investment can be arrived by dividing the Net Income by Total Assets. For example if company Total Assets are $200,000, its return on assets ratio will be as follows:

Return on Assets:   Net Income/Total Assets

ROI:              $25,000/$200,000

= 12.5%

Return on Equity: Return on equity ratio is calculated as dividing the Net Income by Net equity. In other words if company Net equity is worth at $100,000, its Return on Equity ratios will look like as follows:

Return on Equity:   Net Income/ Net Equity

=   $25,000/$100,000

= 25%

Gross Margin Ratio: Gross Margin Ratio can be calculated by dividing the Gross profit by Net Sales. For example: If company gross profit is $50,000 and its net Sales are $250,000. The Gross Profit Margin ration will look like as follows:

Gross Profit Margin Ratio:     Gross Profit/ Net Sales

=    $50,000/$250,000

=     20%

2.Liquidity Ratios: Liquidity ratios determined the company ability to pay it short term obligations normally due within 12 months. There are mainly four liquidity ratio that business or companies would like to find out if they have enough cash to pay its short term debt:

Current Ratio: Current ratio is also known as working capital ratio. The current ratio is calculated by dividing the current assets to current liabilities. For example: If Company net current assets are $150,000 and its net current liabilities are $75,000, The company current ratio will look like as follows:

Current Ratio:         Current Assets/ Current Liabilities

= $150,000/$75,000

= 2 Times

Quick Ratio: Quick ratio is calculated by subtracting Inventory from Current Assets divided by Current Liabilities. For Example: Company Inventory in hand at the end of reporting period amounted to $75,000.

Quick Ratio: Current Assets-Inventory/ Current Liabilities

$150,000-$75,000/$75,000

= 1:1

Cash Ratio: Cash ratios are calculated adding Cash and Marketable Securities divided by Current Liabilities. For Example: If company balance sheet shows cash in hand equal to $100,000 and Its marketable securities on books amounted to $50,000, the its cash ratio should look like this:

Cash Ratio: Cash + Marketable Securities/ Current Liabilities

$100,000 + $50,000/$75,000

= 2 times

Operating Cash Flow: Operating cash flow ratio is calculated as dividing the Operating Cash Flow by Total Debts. For example: company operating cash flow shows $150,000 and Total debt shows $75,000, its operating cash flow ratio should look like this:

Operating Cash Flow: Operating Cash Flow/Total Debts

$150,000/$75,000

= 2 Times

3. Debt Ratios: Debit ratios are also known as leveraging ratios. The ratio is defined as the ratio of total debt to total assets expressed as percentage. These ratios can be interpreted as the proportion of total company’s assets that are financed by company’s debt. The higher of these ratios represent that the company is more leveraged with its debt associated with more financial risk. There are mainly four debt ratios Companies would like to know:

Debit Equity Ratio: Debt equity ratio represent the shareholders equity and the debt used to finance company’s assets. The debt equity ratio can be interpreted as proportion of long term debt plus Value of Leases divided by Total Assets.

Debit Equity Ratio:    Total Liabilities/ Shareholder Equity

For Example: If a company has its total liabilities of $200,000 and total shareholders’ equity of $800,000. Its debt to equity ratio will look this:

Debt Equity Ratio:     $200,000/$800,000

= .25

Total Debt Ratio: Total debt ratio represent the company total liabilities to total assets. The lower the ratio means the company is less dependent on its leverage. In other words, the higher the ratio, the more risk company is taking.

For Example: Let’s assume company total assets at the end of reporting period amounted to $900,000 on the balance sheet. So the total debt ratio will look like this:

Debt Ratio:         Total Liabilities/Total Assets

Debit Ratio:    $200,000/$900,000

= 22%

Interest Coverage Ratio: Interest coverage ratio is commonly used by companies to determine if it can pay interest expenses on its outstanding debt. The ration is calculated by dividing the company earnings before interest and taxes (EBIT) by the total interest expenses. The lower the ratio, the more the company is burdened by its debt expenses. The ratio of less than 1.5 is considered risky as company ability to pay interest expenses will be questionable.

For Example: ABC LTD has its earnings before interest and taxes amounted to $200,000 and Interest expenses amounted to $28,000.

Interest Coverage Ratio:  Earnings before Interest and Taxes/ Interest Expenses

Interest Coverage Ratio: $200,000/$28,000

= 7.14

This represent that the company has good margin of safety to cover its interest expenses.

Cash Flow to Debt Ratio: The cash flow to debt ratio is calculated by dividing the company operating cash flow by total debit. The ratio tell the business owner if they have the ability to cover their debit from its operating cash flow earning. The higher the ratio is, the chances that better the business owner to carry its total debt.

For Example: The Company ABC Ltd. have total operating cash flow amounted to $100,000 and its total debt at the end of reporting period are $130,000. The cash flow to debt ratio will  look this:

Cash Flow to Debt Ratio:         Operating Cash Flow/Total Debt


Cash Flow to Debt Ratio:     $100,000/ $130,000

=   .77

4. Activity Ratios: Activity ratios are those ratios that all business owners like to know if they have the ability to convert different accounts of balance sheet in to cash or sales. These ratios widely used to measure the relative efficiency of a company assets, leverage or other balance sheet items. There are mainly three activity ratios that businesses would like to know:

Stock Turnover Ratio: Stock turnover ratio can be calculated by dividing the cost of goods sold by average inventory. Generally the stock turnover ratio can also be calculated by dividing the sales by Inventory. A low turnover is normally considered a bad sign because products value tend to deteriorate as they sit in the warehouse for longer than average period of time.


Stock Turnover Ratio:           Sales/ Inventory

OR

Stock Turnover Ratio:     Cost of Goods Sold/ Average Inventory

For Example: If a company shows its sales at the end of reporting period amounted to $500,000 and its inventory shows total to $200,000, then stock turnover ratio should look like as follows:


Stock Turnover Ratio             $500,000/$200,000

= 2.5

Assets Turnover Ratios: Assets turnover ratio is calculated by dividing the sales or Revenues by Total assets. Generally speaking, the higher the ratio, the better it is as company generating more revenue per dollar of assets.

For Example: ABC LTD. has total sales at the end of reporting period amounted to $500,000 and its total assets appears on balance sheet at the end of reporting period amounted to $750,000. Then assets turnover ratio can be calculated as follows:


Assets Turnover Ratio:   $500,000/$750,000

= 67%

Inventory Conversion Ratio: Inventory conversion ratio is calculated by total inventory to cost of sales divided by 365. The inventory conversion is measured as against the time required to acquire raw materials for a product, manufacture and then sell it.

Inventory Conversion Ratio        Inventory/Cost of Sales/365

In addition to helping management and owners of business in diagnosing the financial health of their company or business, ratios can also helpful for managers to make decisions about investments or projects that the company is considering to take, such as acquisitions, or expansion.

Still confused or need to brush up your knowledge on financial ratios? Connect with our Online Accounting Tutor and get the help right away.

Why Ignoring Variance Analysis Will Cost You Sales?

Variance AnalysisVariance analysis is an integral part of any business to be successful. It is an important tool for budgetary control by means of evaluating the business performance by analyzing the variance between budgeted amount, planned amount or standard amount and actual amount spent.

What is Variance Analysis?

Variance analysis is the difference between standard cost and actual cost incurred during a given period. Variances analysis can be performed both at cost and revenues level. In other words, if a business owner wants to know what is his planned result and how it will look when comparing it with actual results so he can see the overall performance of the business.

For Example: ABC Company has its monthly sales short by $4000.00 as compared to the forecasted sales of $20,000. The percentage of change was 4000/20000 was 20%. This was due to the fact that business lost one big customer who used to buy the company products for $3,500.00 due to late deliveries of shipment to the customer. That resulted a miss in the forecast of sales.

This kind of variance analysis helps businesses to understand why there is was fluctuation in its business and what it can do make changes in order to prevent this in the future.

That was just one example of variance analysis that business can perform regularly, there are several other most commonly used variances that business can use to determine the health of its business such as:

Selling Price Variance: This analysis can be performed by subtracting standard selling price from actual selling price multiplied by actual number of units sold.

Purchase Price Variance: This can be performed subtracting the standard cost from actual price paid for materials used in the production and then multiplied by the actual number of units sold.

Labor Efficiency Variance: Labor efficiency is performed most by manufacturing company where the business owner would like to know what is the labor efficiency variance for a given period of time. This can be calculated simply by subtracting the standard quantity of labor consumed from the actual amount and then multiplied by the standard price per unit.

Direct Labor Rate Variance. This is very important tool that every business owners wants to know about what is the labor rate variance. This can be performed by subtracting standard labor cost from actual price paid for the direct labor and then multiplied by the number of units sold. Direct labor is considers those manpower who are directly used in the production such as machine operator.

Direct Material Yield Variance: This analysis can be performed by subtracting the total standard quantity of material from the actual quantity used then multiplied by the standard price per unit.

Fixed Overhead Spending Variance: Fixed overhead are those expenses that never changes irrespective of sales volume such as salary, rent, insurance, utility expenses. This analysis can be simply performed by subtracting standard cost from fixed overhead cost for any reporting period. If the standard cost exceeds the actual fixed overhead the analysis can assume that they have controlled and managed their fixed expenses well. In other words, if standard fix overhead expenses exceed actual fixed overhead expenses, then business is spending more than on its fixed expenses than its planned.

Variable Overhead Expenses Variance: Variable overhead expenses are those expenses which tend to change when sales volume change such as cost of cost of goods sold, sales commission. This variance can be performed by subtracting the standard variable cost per unit from actual cost incurred during any reporting period and the multiplied by the total actual units.

These variances helps the business owners to understand and manage the present cost and control the future cost. By applying these variances in practice, businesses or companies can save its cost and therefore increase the value of its stockholders.

Still confused about how to apply these variances analysis using excel? Connect with our online accounting tutor today and lean to how to become master in the variance analysis.

3 Ways Companies Can Lower Its Break-even Point

Online Accounting Tutor, Break-even PointBreak even analysis is a key financial tool that every business uses to find out how much they would have to sell in order to cover their fixed expenses. You as a business owner should know about what are your fixed and variable expenses. Break-even point is calculated to determine how much volume of sales you need in order to make profits. It is also an important part of cost-volume-profit analysis.

What is Breakeven Point?

A company break-even point is the point where business sales are equal to both variable and fixed expenses. The company will need to sell enough units in order to be no profit or no loss. This point is called break-even point.

If company sells fewer units of its products, it will incur loss as it will not be able to cover all fixed and variable expense or in other words, if it sells more, it will make profits. To calculate a break-even point, you will need to remember three things:

  • Fixed Expenses: Fixed expenses are those expenses that do not change irrespective of sales volume such as rent, salary, insurance, utilities, office, depreciation, fees etc.
  • Variable Expenses: Variable expenses are those expenses which tend to change with the volume of sales such as cost of goods sold.
  • Price: The price of the product is the price set by the company to sell at wholesale price or cost of manufacturing the product plus mark up.

The Formula for calculating Breakeven Point:

Fixed Cost/(Sell Price-Variable cost)= Breakeven Points (In units)

In the above example, the fixed costs are stated as a total cost whereas the variable cost is stated as per unit cost. In other words the variable cost is calculated by deducting variable cost per unit from sell price per unit. It is also called contribution margin. In other words, the contribution margin is calculated as follows:

Contribution margin =Sell price per unit – variable cost per unit

Example: ABC Inc. has its fixed cost consisting of rent for property, executives’ salaries, property taxes and depreciation on fixed assets for up to $120,000. Its variable cost consisting raw material, factory labor, and sales commission calculated as $1.60 per unit, the product selling price is at $4.00 each.

Given the above example, we can calculate the ABC breakeven point as follows:

Break-Even Point: Fixed Cost/ (Selling Price-Variable Cost)

Break-even Point (BEP): $120,000.00/ ($4.00-$1.60)

=50,000 Units

Give the above example, Company would need to sell 50,000 units to cover its fixed expenses. This is called Break-even point where company will be making no profits and no loss. So If company need to make profit, it would need to sell more than 50,000 units.

3 ways to lower your Break-Even Point:

Let’s say, if the economy is in downturn or recession, the sales volume will drop as there will be less demand for the product company sell. In that case, company will not sell enough to cover its fixed expenses.

In the above example, ABC Company will not be able to sell 50,000 units to cover its fixed expenses. Here is what company can do to sustain in the downturn market.

  1. Company can either increase its sales price so it can meet its fixed expenses. Or
  2. It would have to cut down its fixed expenses so even if the sales volume down, it can still cover fixed cost.
  3. Up-sell and Cross-sell

Let’s say you have found a way to reduce your fixed cost. You are getting a cut in your salary by $20,000. Now the fixed cost will be amounted to $100,000. The new break-even point will look like as follows:

Break-even Point (BEP): 100,000.00/ ($4.00-$1.60)

= 41,666 Units

As you can say, the company will now need to sell 41,666 units as compared wit 50,000 units to cover its fixed cost.

In another example, let’s say you don’t want to make a cut in your salary, instead you would like to raise product selling price per unit.

The new selling price is $4.50

Break-even point= 120,000/ ($4.50-$1.60) =41,379 units

In both the example, you will need to sell lesser units to cover your fixed expenses. However, the better option is number two where company to raise its selling price.

Still confused about how to calculate breakeven point or need to learn more about Break-even point?  Connect with live Online Accounting Tutor  to receive help right away.

9 Most Popular Interview Questions Teachers Are Asked

teachers interview questionsPreparing for an interview is the most challenging phase when it comes to getting a new job position. You might be thinking oh well it will be alright until you enter the interview room where a panel of educators, superintendent, principals, teachers and parents judging you for each of you move and wording. Ideally the more you prepare for an interview; the chances are that you will secure a job they are offering. One thing you always remember, when you are going for an interview, never lies to the interviewer. Be honest about your background, your teaching experience, and your degrees.

I have compiled a list of 9 most common interview questions asked by the interviewers. Keep in mind these are just some possibilities and should not be taken as discretion.

Tell me something about yourself

This is the first basic question that most likely to be asked by an interviewer. This is I call a 2 minutes demo to showcase your talent. This is a great opportunities to brag yourself to the interviewer. Keep in mind that the first question you answered is either going to get your job or not getting your dream job. So the answer you give need to be very strong. You might start by saying about your degrees, certification, and give a quick or summarize your work experience. The last 1 minute should just be focused on your strengths and skills you have to help the students or improve their learning. Also at the end, you may want to mention why you would want to work for the company ad what qualities you will bring in to the organization.

As high school teacher, how would you motivate parents to become involved in the classroom and in their child’s education?

This is actually a very good question that you might answer very smartly, tell the interviewer that you will want to contact the parent not only when the student is not doing well in the class but also inform them when student is really doing well in the class. You may also want to tell about the importance of parental involvement in the child academic career such as reading with students, preparing project materials, creating bulletin
boards, sorting materials, setting up learning centers, hanging up students’ work, etc.

Are you flexible in teaching style, if so why?

You can start saying yes you are flexible in your teaching style and highlights some points why are you are flexible such as you can deal with different backgrounds and socio-economic group. In teaching, you are aware that student have different learning pace. Some are fast learning and some are slow learners and you are flexible in accommodating your teaching style for all kinds of learners. There is so much information that I want to share with them to have a comprehensive understanding about concept. I make sure that I structure my lessons so effectively that learning takes place in one class period so I plan ahead to maximize every minute of my class period.

What are the different ways do you assess and evaluate your students?

You can start saying that you use different methods in assessing students such as conducting formal and informal assessment procedures to promote social, academic, and physical development. You formal assessment procedures involve written quizzes and examinations. You also grading and assessing student participation in their class such as recitations, reports, group activities, and seat work. You also grade your students based on their completed assignment and timeliness of assignment submission.

What strategies will you implement to meet the needs of a gifted students?

It can be a big challenge having gifted students with regular students in addressing their needs. You will modify the student work assignment expectation and grade the gifted students accordingly. Gifted students require a high level of understanding as compared with regular students. I will also ask the students play a role model role so other regular students inspired by him/her.

What are some modern trends, issues, and methodology in education and how would you address them?

You can start by saying that here are some trends, issues and methodology that you can address by educating the students about the tons of information they can learn over the internet now. How internet can be used in a positive way and teach the student on how to stay away from negative influences on the internet. One of the most important methodologies in my opinion is teaching through multiple intelligences. Students learn in so many different ways. I try to reach everyone by teaching through the senses, using visual, auditory, and sense of touch to impart information.

How do you stay current with modern technology in Education?

I love education and I plan to continue my education to cope with the latest trend in education and try to implement the same in my class. Nowadays students have too many devices to learn such iPad, Tablet, PC’s and hand held devices are some of the new gadget in the market. These new gadgets provide interactive, individualized learning experiences, increasing student engagement and therefore improve learning process.

How do you differentiate your teaching from others?

I would answer this question by saying that I take a holistic approach in my teaching as it is more of an individualized and inclusive approach. It is holistic because I first gathered the information in the order and then share that information with the students and that’s what my teaching approach is unique and different from others. . I also explained to my students the value of understanding numbers and the great things we can use math for, such as the ability to think logically. I include all students in my lessons. I use cooperative learning, peer tutoring approach, and re-teaching techniques. I also provide additional resources links such a homework help, online math tutoring, test practice sites and more which tend to help students improve their learning.

Why should we hire you?

This is the last interview question you will need to answer very carefully. You can answer this question by saying that they should hire you because you possess the necessary skills and experience to perform the job better and you can deliver an exceptional results. If you get hired, it will be great addition to the team.

Knowing the answers to these commonly asked questions will give you an idea of expectations for teachers in the district and may encourage for a discussion on potential places of growth for school district to take in meeting the needs of the math teachers.

Stages Of Mitosis-An Important Study In Biology

Mitosis is the type of cell division by which a single cell divides into two daughter cells. It is the method by which the body provides new cells for growth or repair of aging or damaged tissues. Mitosis occurs in all somatic cells except gamete (the reproductive parts).

MitosisMitosis is a complex physical process and is divided into phases which balance with the completion of one phase and starting of the other. These phases are called Interphase, Prophase, Metaphase, Ana phase and Telophase. During all these phases, pairs of chromosomes flock, amalgamate and affix themselves to fibers which pull sister chromatids to opposite sides of the cell wall. Cytokinesis completes the cell division by dividing the cell membrane and thus daughter cells are produced.

During Interphase, the cell does not undergo division but executes all activities for life. It reads DNA which is essential for a replica cell of the parent cell during mitosis.

During Prophase, the commencement of cell division occurs. The combination of DNA and proteins (chromatin) formed in Interphase coagulates to actualize into chromosomes. The nuclear membrane formed during Interphase breaks, the chromosomes become shorter and thicker and migrate towards the opposite sides of the cell. They are bound at the centromere, interconnecting two sister chromatids and forming an X.

In ProMeta phase nucleus membrane formed in Interphase   starts dissolving and spindle fibers invade the nucleus space and proteins affix to the centomeres creating kinetochores. In Metaphase, nucleus membrane dissolves completely and spindle evolves in complete form. The fibers alienate chromosomes in an imaginary line .Anaphase is the phase of separation of chromosomes wherein the spindle fibers attached to the kinetochore distance the chromatids from each other resulting in two daughter chromosomes.

In Telophase, the chromosomes are roped off into two nuclei in daughter cells with spindle fibers disintegrating and chromosomes unwinding and a new nuclear case reforming around the daughter nuclei. Thus ends the process of mitosis.

An online Biology tutor explains such topics in a lively manner and invites the attention of students  towards more interesting topics in Biology.

Periodic Table Of Elements – Your Ready Guide For Knowing About Elements

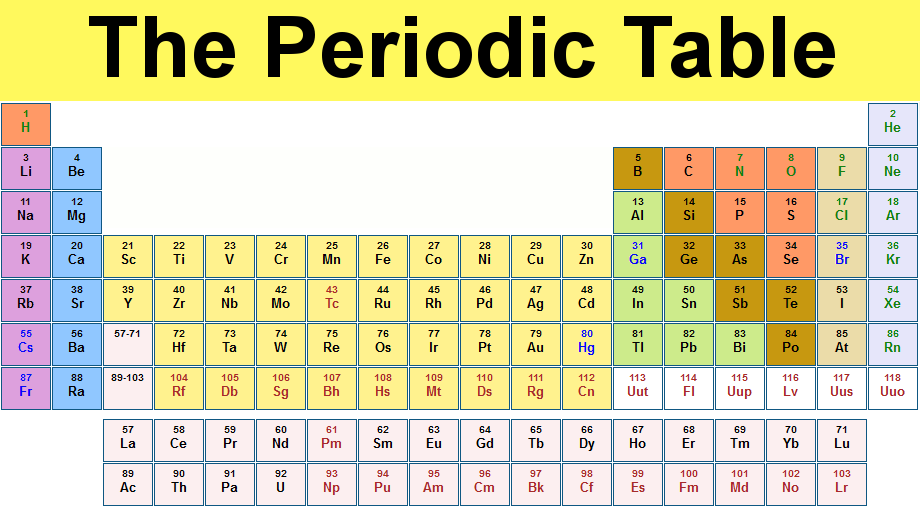
Periodic table is the table of elements categorically organized to give information about the elements. It is very essential for a firm grasp of basic Chemistry.

periodic-table

The first elemental table was published by the Russian professor Dimitri Mendeleev in 1869. He categorized 63 known elements based on their properties like atomic weight. In 1913, Henry Moseley found out that the order of elements depends upon the number of protons in the atom and not on atomic weight.

The groups or families in the periodic table are shown by vertical columns. Each family has 18 columns with 1 through 18 numbers. The periods in the periodic table are shown by the rows of the table and labeled by 1 through 7 numbers containing elements that increase in atomic weight from left to right. Blocks are another kind of categorization. Blocks are shown by making rectangular like sections in periodic table.

You can categorize the elements by way of metals, non metals, and metalloids also. Metals are split into six types like alkali, alkaline, lanthanides, actinides, transition and post transition. Non metals are categorized into three like noble gases, halogens and other non metals. There are only a few metalloids in periodic table. And they are placed between metals and non metals.

Since there are new elements found by the scientists day by day, knowing periodic table helps students gather fundamental knowledge in basic Chemistry. It is also advisable to approach online Chemistry tutors for this purpose and get to know more about the elements and how they are categorized in the periodic table.

Not only periodic table, other interesting topics and more intricate ones can be easily understood by students with the help of tutors in online Chemistry tutoring via smart strategies and useful tips. The tutors in their personalized sessions are able to throw light on the complex topics with easy to understand methods and help students improve their scores in Chemistry.

Why Tutor Pace Is Best To Provide Assignment Help Service?

Do you have lots of homework and assignment and actually you are feeling so tense? Want to get quality assignment help? Looking for best way to complete your assignment easily? Here is the great solution of your assignment problem known as Tutor Pace.

We are an online tutoring website that offers plagiarism free work, high quality and express delivery assignment help to students. Our site has several experienced and intelligent online instructors who are able to help you in finishing your homework and assignment task within a few hours. The best thing is that our website provides 10% off on assignment help. So get best assignment help services with expert tutors right now.

Why to Pick Tutor Pace for Assignment Help?

Our efficient and brilliant tutors are always ready, even round-the-clock assignment help for all your academic needs. Our charges are very low because we do not want to make hole in your pocket. We charge minimum rates for quality and best assignment help. So no issue for budget, just come and select your tutor and complete your homework of any subject. Our mastermind instructors take only few hours to upload your perfect assignment and you will feel tension-free. No tension at all when we are here for your help 24 hours a day and 7 days a week.

Female student

Assignment Help that Actually Helpful to Students: All private sessions are personalized around your homework assignment. Our instructors work with you step-by-step to teach the basics of every question. Our experts just don’t provide you the satisfied answers, but also understand your difficulty. We have very dedicated team to solve out all your homework related problems. You do not need to worry about your homework and assignment as solution is just a click away.

We Provide Customized Assignment Help: If you need immediate assistance for your assignment, then Tutor Pace can help you completely to finish your homework and teach you the important skills you have to know solving any problem.

Get Assignment Help at Unbelievable Rates: If you do not have budget to take expensive homework help, then Tutor Pace is perfect choice for you. Our certified and expert online instructors are available every time for your best help. We provide English, Social Studies, Science and Math assignments to needy students. You never get this type of quality and quick assignment help, so get it now.

What Are The Significant Features of Assignment Help?

  • Assignment is plagiarism free
  • Students can track assignment progress
  • Certified researchers and tutors
  • Help for all subjects
  • Tutors are available every time on video chat
  • You will get 24/7 tutor help
  • Get quality homework help at the most reasonable rates
  • You will receive on-time delivery
  • Our tutoring site has handful of tons expert tutors for all your and paper writing, essay writing, literature and proofreading
  • Expert writer from Canada, UK and US

Not only these, you will get free revision help from our site. Actually, we provide free limitless revision of all submission of assignment work. Our 98% students are totally satisfied with our quality services. We give you a guarantee that our site beat all our rival’s rates. So take advantage before getting too late…